Projects
Heat Map Solver
A heat map visualization tool created in Excel. The program takes several points (X's) in a grid as input and outputs a combined heat map with smooth gradients.
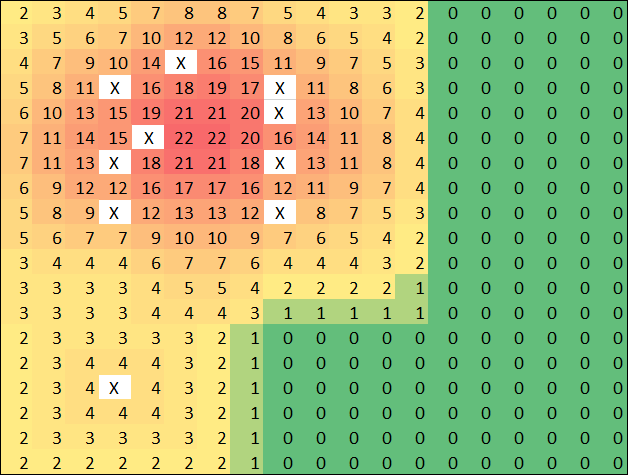
Figure 1
Heat Map Visualization
Visualization of the point density in Excel.
Excel File Download
Download the heat map visualization Excel file.